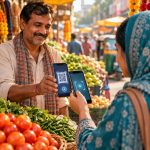


The $1 Trillion Inflection Point
Livestream shopping began as a Chinese phenomenon — live video product demonstrations with in-stream purchase links — and scaled to a market where Taobao Live generated $550 billion in gross merchandise value and Douyin reached $375 billion GMV before most Western retailers had run a single live shopping event.
GetStream’s livestream shopping data puts the 2026 global market at over $1 trillion, up from $682.5 billion in 2023 — a compound annual growth rate approaching 40%. In China, live commerce represents 19.2% of all retail e-commerce sales. Merchant-led streams (as opposed to influencer-led) now comprise 70% of Douyin’s e-commerce livestreams, accounting for 40% of GMV — a structural shift that indicates brands, not just creators, are driving the format’s maturation.
The 2026 inflection outside China is confirmed by platform data. TikTok Shop’s Black Friday 2024 event generated $100 million in sales across 30,000+ shopping livestreams — three times the prior year’s Black Friday performance. US social commerce is projected to surpass $102 billion in 2026, representing an 18% increase from 2025. Sprout Social’s e-commerce research reports that 76% of consumers who engaged with TikTok Shop made a purchase from a livestream — a conversion signal that far exceeds display, search, or influencer content benchmarks.
Why Conversion Rates Change the Retail Math
Traditional digital advertising drives 1–3% conversion rates on a good day. Live commerce produces conversion rates that, in established markets, cluster between 8% and 30% depending on category, host credibility, and production quality. The difference is structural, not incidental.
A livestream purchasing event eliminates three of the highest-dropout friction points in conventional e-commerce: product discovery (the host demonstrates the product in real use), trust uncertainty (real-time Q&A addresses objections before they cause cart abandonment), and decision hesitation (scarcity mechanics and limited-time pricing create urgency that static product pages cannot).
GetStream’s data identifies the viewer motivation breakdown: 40% of viewers cite convenience as the primary draw, 36% value live product demonstrations, and social features — real-time chat, polls, and peer reactions — statistically strengthen buyer confidence in the host. This confidence effect is measurable: Amazon Live studies show a 55% increase in branded search rates when consumers are exposed to live ads versus other formats.
The implication for merchant economics is significant. A 15% live commerce conversion rate on a campaign with 5,000 simultaneous viewers generates 750 transactions. The equivalent impression volume in display advertising, at a 1.5% conversion rate, would require 50,000 ad impressions to match — with dramatically different cost structures. For merchants with strong brand narratives and demonstrable products, live commerce is not just a new channel; it is a structurally more efficient acquisition model than what preceded it.
Advertisement
What Merchants and Platform Teams Should Do in 2026
The market structure of live commerce is still early enough that first movers in most markets can establish category leadership without competing against entrenched players. The playbook from China, Southeast Asia, and the early US market is documented and transferable.
1. Build Your Host Infrastructure Before You Build Your Production Infrastructure
The single most consistent predictor of live commerce success is host credibility, not production quality. Across the Douyin, TikTok Shop, and Amazon Live data, high-converting streams share one characteristic: a host (brand employee, founder, or creator partner) who can answer product questions in real time, handle objections without scripts, and maintain authentic engagement across a 30–90 minute session. A well-lit, well-hosted stream with a smartphone and ring light outperforms a professionally produced stream with a disconnected presenter. Invest in host training and incentive structures before investing in studio equipment.
2. Match Category to Format Expectations — Not Every Product Lives in Livestream
GetStream’s category data shows fashion and apparel commanding 28%+ of live commerce market share, followed by beauty, consumer electronics, health and wellness. These categories share a common feature: high sensory information value from live demonstration. A garment showing fit and drape on a moving body tells a story a static product image cannot. A skincare application demonstrates texture and absorption that a photo cannot convey. Electronics showing real-world performance benchmarks bypass spec-sheet scepticism. Commodities with low sensory differentiation — industrial supplies, standardised components, basic consumables — do not convert meaningfully in live formats. Map your catalogue to format fit before committing to a live commerce programme.
3. Design for the Mobile-First Buyer, Not the Desktop Viewer
Sprout Social’s data confirms that 70% of retail orders now occur on smartphones, and live commerce audiences skew heavily mobile. This has immediate design implications. Stream UI must accommodate portrait-mode consumption; product cards must be tap-complete in two steps, not four; checkout flows must not require desktop browsers for credit card input. A/B test your mobile checkout path specifically on live traffic — live commerce buyers have a shorter decision window than browse-and-compare shoppers. Friction at checkout during a peak live session is irreversible; the purchase moment passes if the payment flow takes more than 45 seconds on mobile.
4. Plan Your Scarcity Mechanics With Inventory Realism
Scarcity is the conversion engine of live commerce. Limited quantities, time-bounded pricing, and exclusive bundle configurations drive the urgency that separates live commerce conversion rates from static e-commerce benchmarks. But scarcity mechanics require disciplined inventory management: overselling during a live event generates customer service backlogs, refund costs, and brand trust erosion that can take months to recover. Model your worst-case sell-through scenario (all 500 reserved units in 8 minutes at a 4× session peak) before your first high-traffic live event. Build hard inventory locks into your commerce stack so that checkout success confirmation is only triggered after real inventory deduction — not as a batched post-session reconciliation.
The Structural Lesson: Live Commerce as a Global Retail Standard
Southeast Asia leads emerging market adoption — India at 75%, Thailand at 73%, UAE at 72% — while European markets show 35% consumer purchase participation and Latin America sees 64% of frequent users attending shopping streams regularly. These numbers indicate that live commerce adoption outside China is following a geographic diffusion curve that will reach near-universal merchant presence within 3–5 years.
The MENA region — where UAE adoption already sits at 72% — is structurally positioned as the fastest-growing live commerce market in the coming 24 months. High smartphone penetration, young median age demographics, and the regional influencer economy that already drives significant product discovery via Instagram and YouTube create the infrastructure for live commerce adoption without a dedicated platform build. Merchants in the MENA region who have already built Instagram and YouTube commerce audiences have transferable host relationships and content production workflows — the incremental investment to extend these into structured livestream selling is lower than building from zero.
Global e-commerce is projected to exceed $6.8 trillion in 2026, growing 7.2% year-over-year. Live commerce at $1 trillion represents approximately 15% of that total — and is growing at 40% annually while the broader market grows at 7%. The format is no longer a niche experiment; it is a structural component of global retail that merchants without a live commerce strategy are now actively choosing not to compete in.
Frequently Asked Questions
What makes live commerce convert at higher rates than traditional e-commerce?
Live commerce eliminates three key friction points that cause cart abandonment in conventional e-commerce: product discovery uncertainty (live demonstration answers “does this actually work?”), trust hesitation (real-time Q&A removes pre-purchase objections before they solidify), and decision delay (scarcity mechanics and time-bounded pricing create urgency that static pages cannot replicate). The combination produces conversion rates of 8–30% versus 1–3% for standard digital advertising.
Which product categories work best for live commerce, and which don’t?
Categories with high sensory information value perform best: fashion (fit and drape in motion), beauty (texture and application), consumer electronics (real-world performance), and health and wellness (demonstrable effects). Categories with low sensory differentiation — standardised industrial components, basic commodities, or products where spec sheets fully describe the value proposition — do not generate meaningfully higher conversion in live formats and may not justify the production investment.
How large is the live commerce market in MENA, and how does it compare to Southeast Asia?
MENA adoption is advanced relative to most Western markets: UAE consumer participation sits at 72%, and the region’s social commerce ecosystem (Instagram, TikTok, Snapchat) provides existing infrastructure for live selling without new platform adoption. Southeast Asia leads globally in penetration — India at 75%, Thailand at 73% — driven by super-app integration (Shopee, Lazada, Grab) with native live commerce features. MENA is approximately 12–18 months behind Southeast Asia’s current adoption curve but ahead of European markets (35% consumer participation).
Sources & Further Reading
🔗 Related Intelligence

Live Commerce in MENA: How Brands Are Turning Livestreams Into Sales Machines

Beyond the Billion-Dollar Headline: How Brands Actually Build Profitable Social Commerce Programs in 2026

Recommerce Hits $231B: Digital Resale Platforms Are Reshaping Global Retail Economics

The $7 Trillion E-Commerce Pivot: Mobile, Social Commerce, and the Digital Product Passport